Several concurrent demand cycles are running underneath this industry, on largely independent timetables, in different geographies, with different regulatory pull behind each one. Conflating "the LiDAR market" into one number — as most published market-size estimates implicitly do — is the single easiest way to misread this sector, and it is worth stating plainly before the dispersion chart below: this report found no two published estimates that used the same scope, base year or definition.
| Demand cycle | Anchor buyer | What is actually driving it |
|---|---|---|
| 1. China L3/L4 regulatory certification | MIIT (Ministry of Industry and Information Technology) | GB 44721-2026, China's first mandatory national safety standard for L3/L4 automated driving, approved 2026 and taking effect 1 July 2027; MIIT's own certification-standards work explicitly names LiDAR among required L3 hardware configurations, alongside high-precision maps and compute — a rare case of a regulator naming the sensor class directly |
| 2. China robotaxi commercialisation | Baidu Apollo Go, Pony.ai, WeRide and peers | Apollo Go alone reported cumulative rides surpassing 100 million in H1 2026; RoboSense won an exclusive next-generation Apollo Go LiDAR design win (12 March 2026, high-channel EM4 plus solid-state E1 for blind-spot coverage) and a WeRide GXR robotaxi deployment the same week — real, named, dated design wins, though the winning supplier in these specific cases is not US-listed (see §9 and Appendix) |
| 3. US automatic emergency braking regulation | NHTSA (National Highway Traffic Safety Administration) | FMVSS 127, finalised May 2024, requires pedestrian AEB performance up to 62mph by a 1 September 2029 compliance deadline — but is sensor-agnostic (does not name LiDAR) and, as of a 23 March 2026 DOT status filing, is under a proposed rulemaking that would extend compliance lead time by two years; a materially weaker and less certain anchor than China's — see the trap box below |
| 4. Industrial & robotics automation | Warehouse/logistics operators, AMR and robot-vacuum makers | Broad, real unit-volume growth, but concentrated at the commodity, short-range, 905nm end of the value ladder (§5) where the barrier to entry is lowest and competition is most intense, much of it from unlisted Chinese suppliers not covered in this report (see Appendix exclusions) |
| 5. Non-automotive mapping, surveying, defence & agriculture | Geospatial services firms, defence primes, precision-agriculture equipment makers | A real, steady demand pool that mostly sits inside diversified companies' segment revenue (Trimble, Teledyne, Hexagon/Leica — see Appendix) rather than showing up in "automotive LiDAR market" headlines at all — see §8 |
Source: Dart Consultants, compiled from federalregister.gov and nhtsa.gov (FMVSS 127), cnevpost.com and easyrain.it (GB 44721-2026, MIIT certification standards), gasgoo.com/prnewswire.com (RoboSense-Apollo Go design win, 12 March 2026), and bydtoday.com (Apollo Go ride-volume milestone) — see Notes for full citation list.
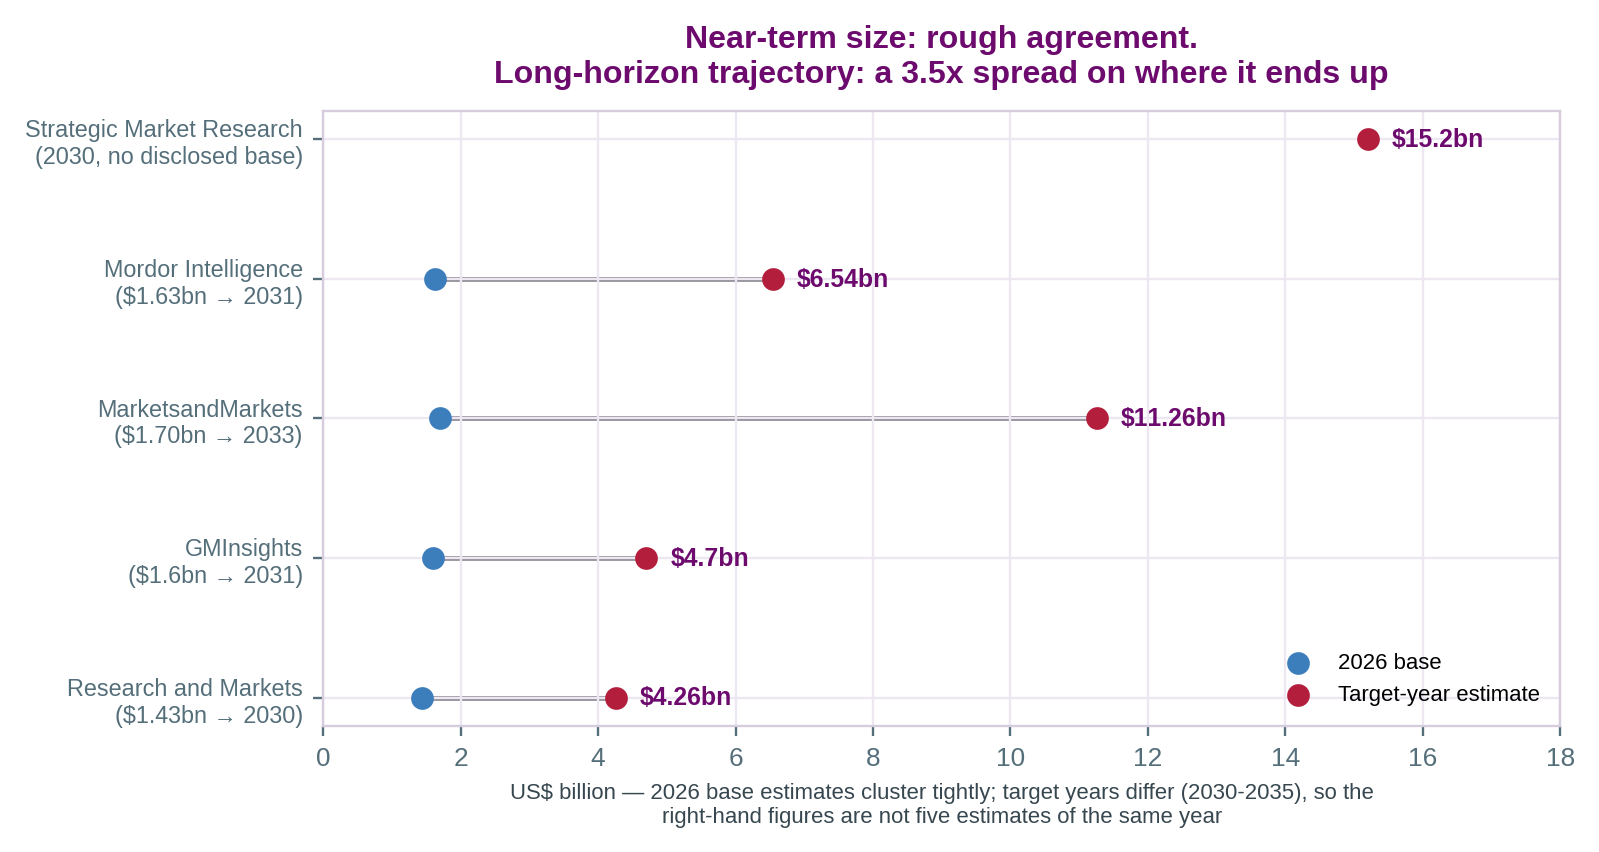
Five market-research firms covering "the automotive LiDAR market" actually agree reasonably closely on where the market is today — 2026 estimates cluster between $1.4bn and $1.7bn. Where they diverge sharply is the long-horizon trajectory: compounding that similar 2026 base forward at CAGRs ranging from 24.1% to 32.1%, over target years that are themselves not the same (2030, 2031, 2033, 2035), produces end-point estimates from $4.26bn to over $15bn — a more-than-3.5x spread on figures that read, in a headline, as if they were forecasting the same thing. Reporting only the largest or the newest end-point without saying so would be exactly the failure mode this report exists to avoid.